Project / Fall 2025

Uber India Ride Analytics

Year

Fall 2025

Type

Data Visualization · Tableau

Skills

Tableau

Data Visualization

Hypothesis-Driven Analysis

Business Analytics

Dashboard Design

What I Built

Interactive Tableau dashboard testing three business hypotheses against Uber India ride data — two confirmed, one rejected.

Built an interactive Tableau dashboard testing three business hypotheses against Uber India ride data. Two confirmed, one rejected — and the rejected one (premium vehicles don't outperform) was where the real analytical work happened.

Framed around three testable business hypotheses: whether driver wait time drives cancellations, whether premium vehicles generate higher booking values and ratings, and whether digital payments dominate revenue. All three produced definitive answers — two confirmed, one rejected. The final dashboard was published to Tableau Public with vehicle-type and payment-method filters. The most important finding came from the rejected hypothesis: premium vehicles didn't outperform. UberXL had the lowest typical booking values of any tier, and customer ratings were effectively flat across all vehicle types. The visualization that surfaced this also went through the most revision — and catching that wrong chart was where the real analytical work happened.
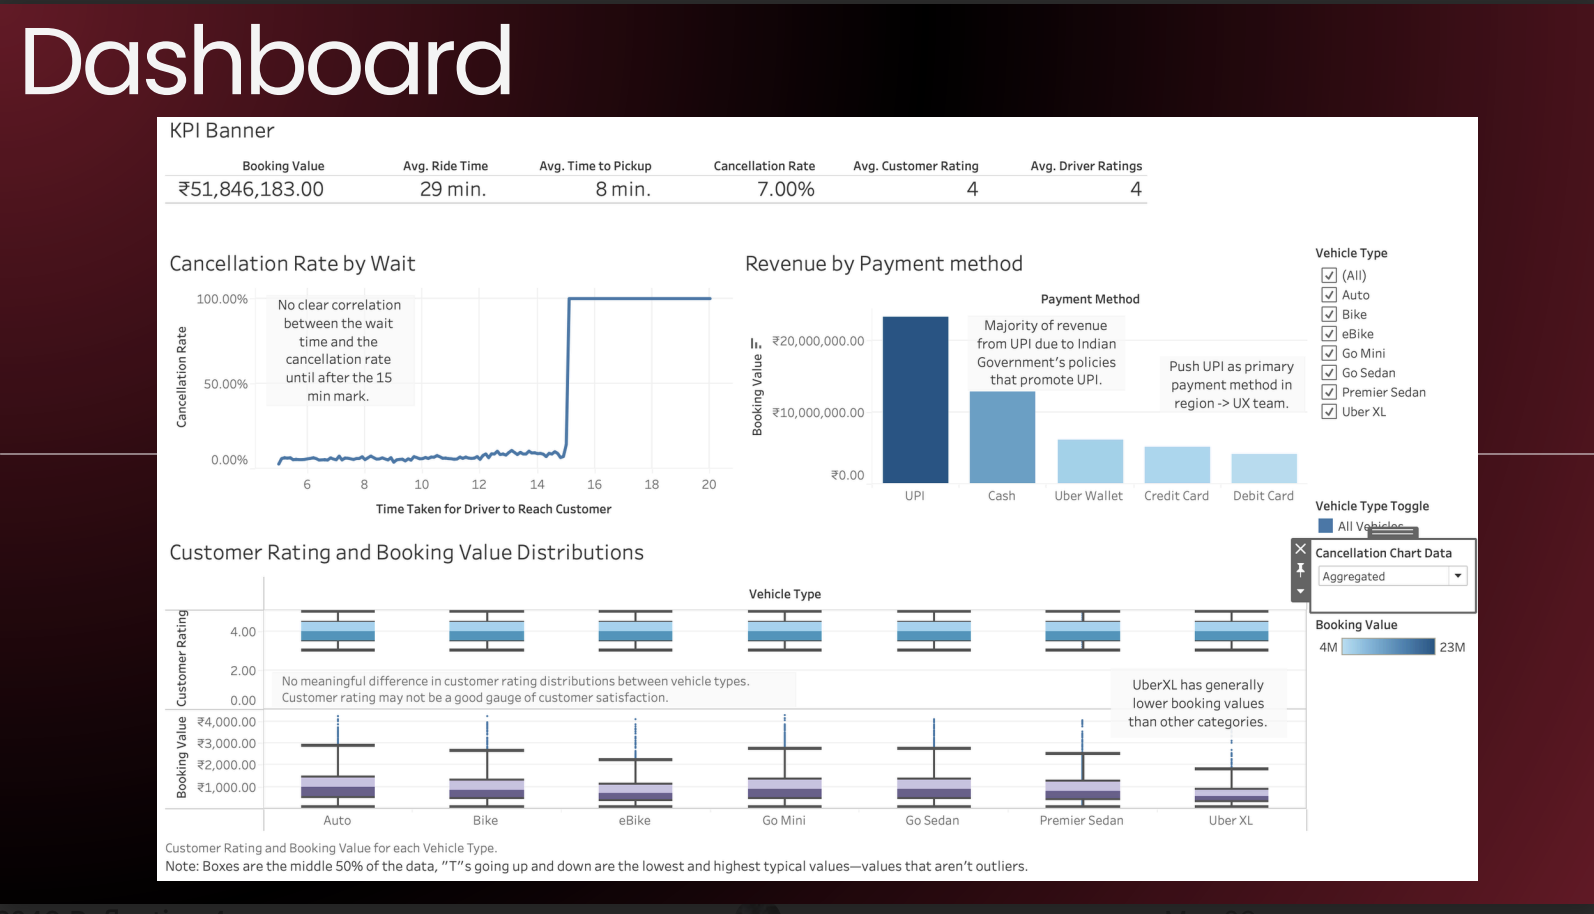
Final Tableau dashboard. All three hypothesis charts consolidated under vehicle-type filters, with KPIs across the top: total booking value (revenue), average ride time, average time-to-pickup, cancellation rate, and average customer and driver ratings.
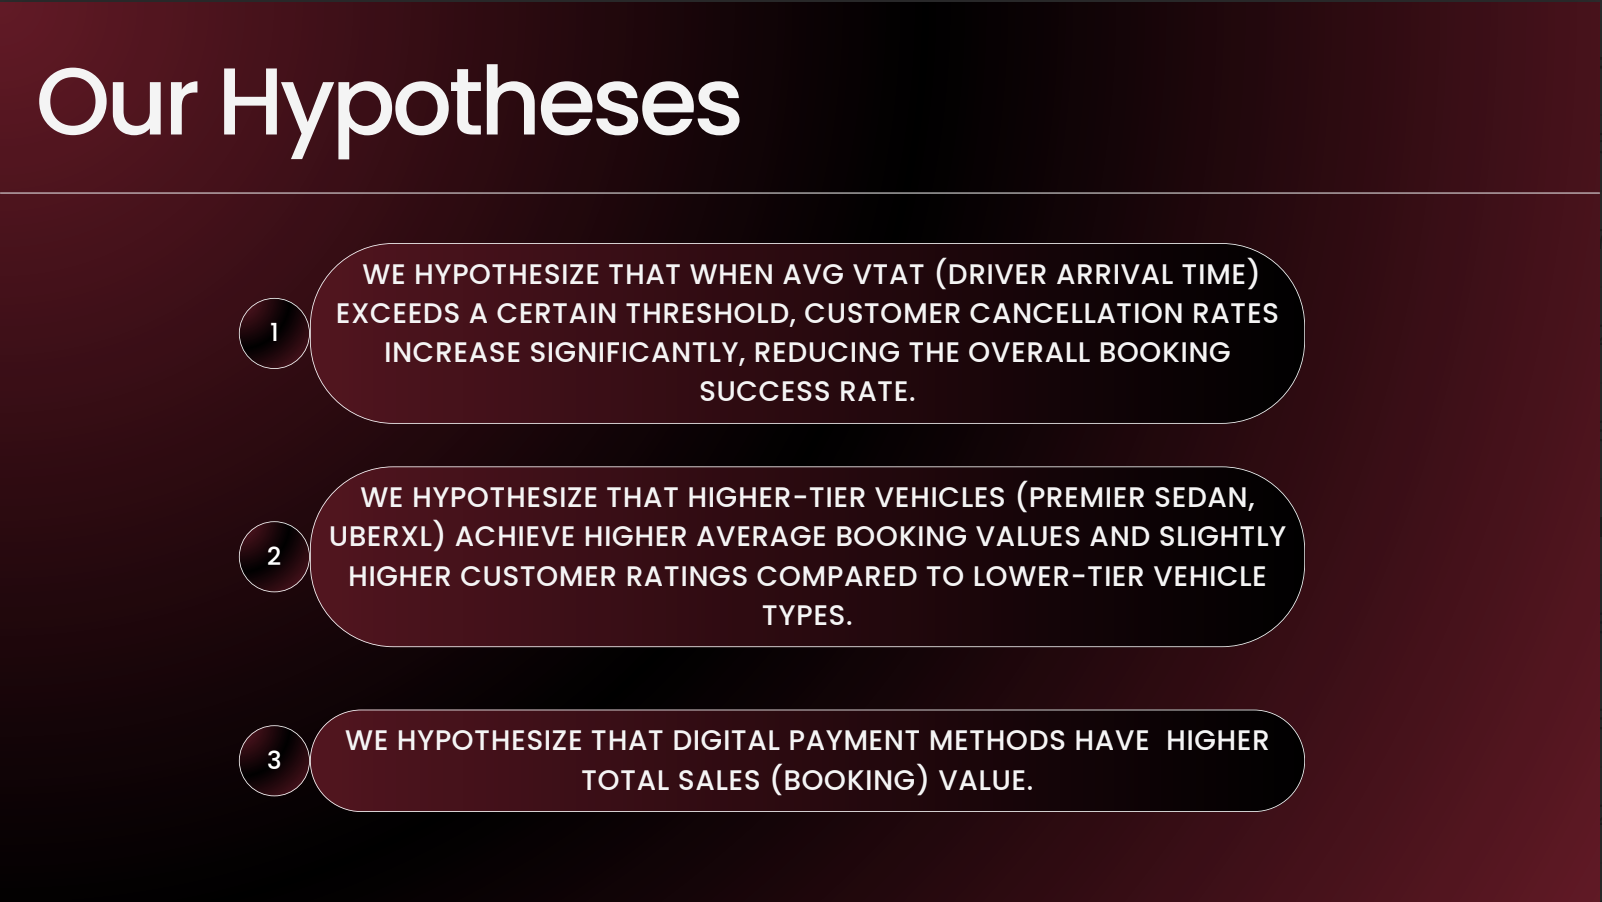
The three business hypotheses framing the analysis — driver wait time vs. cancellations, premium vehicle value and ratings, and digital payments vs. revenue dominance.
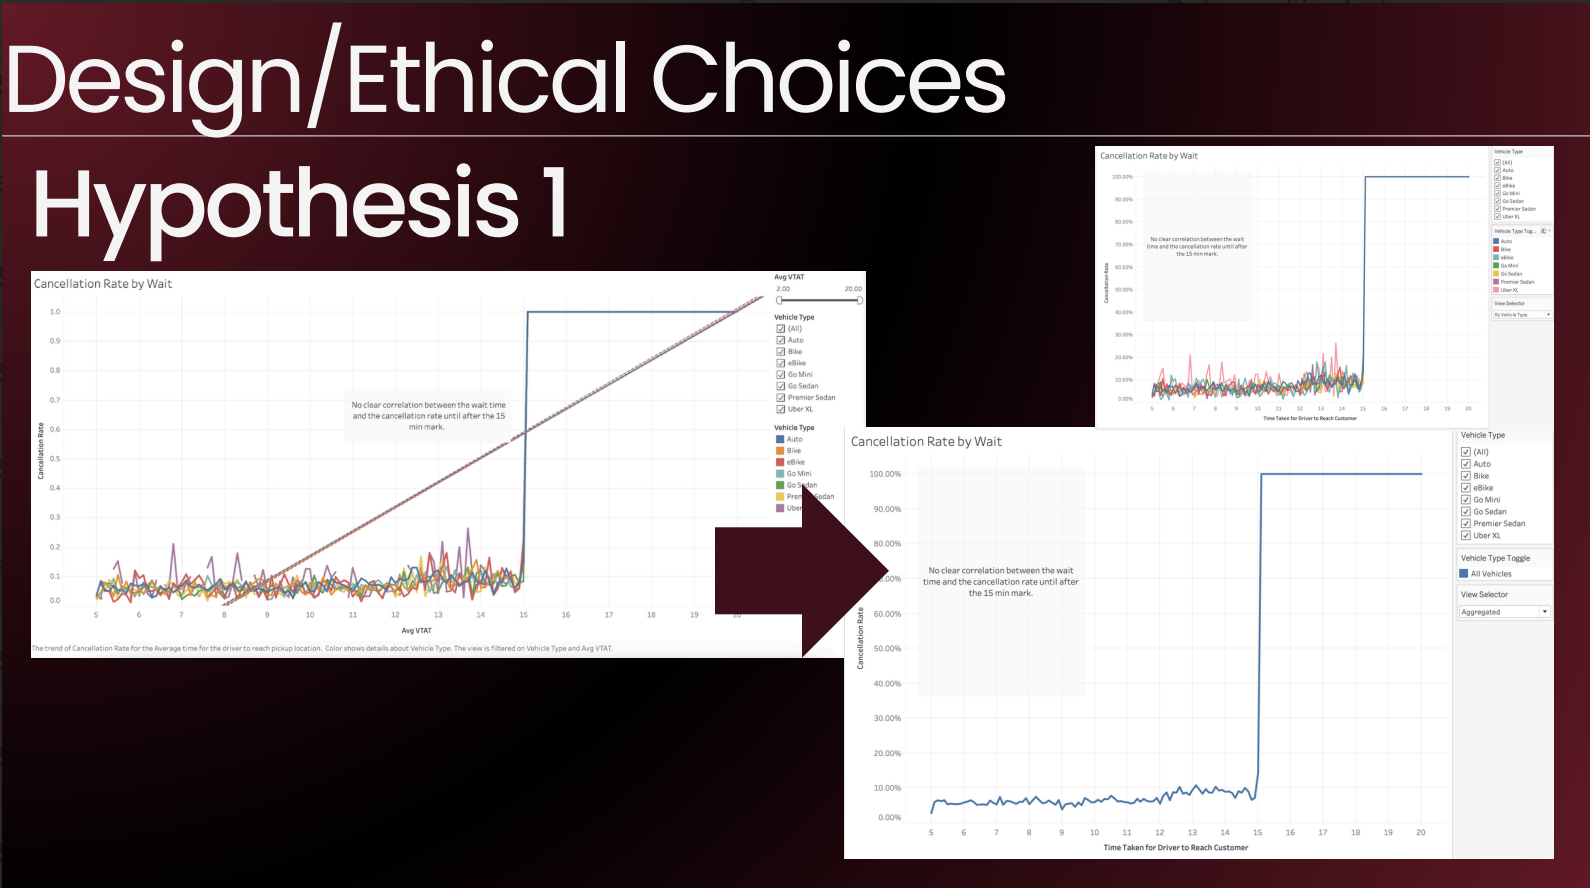
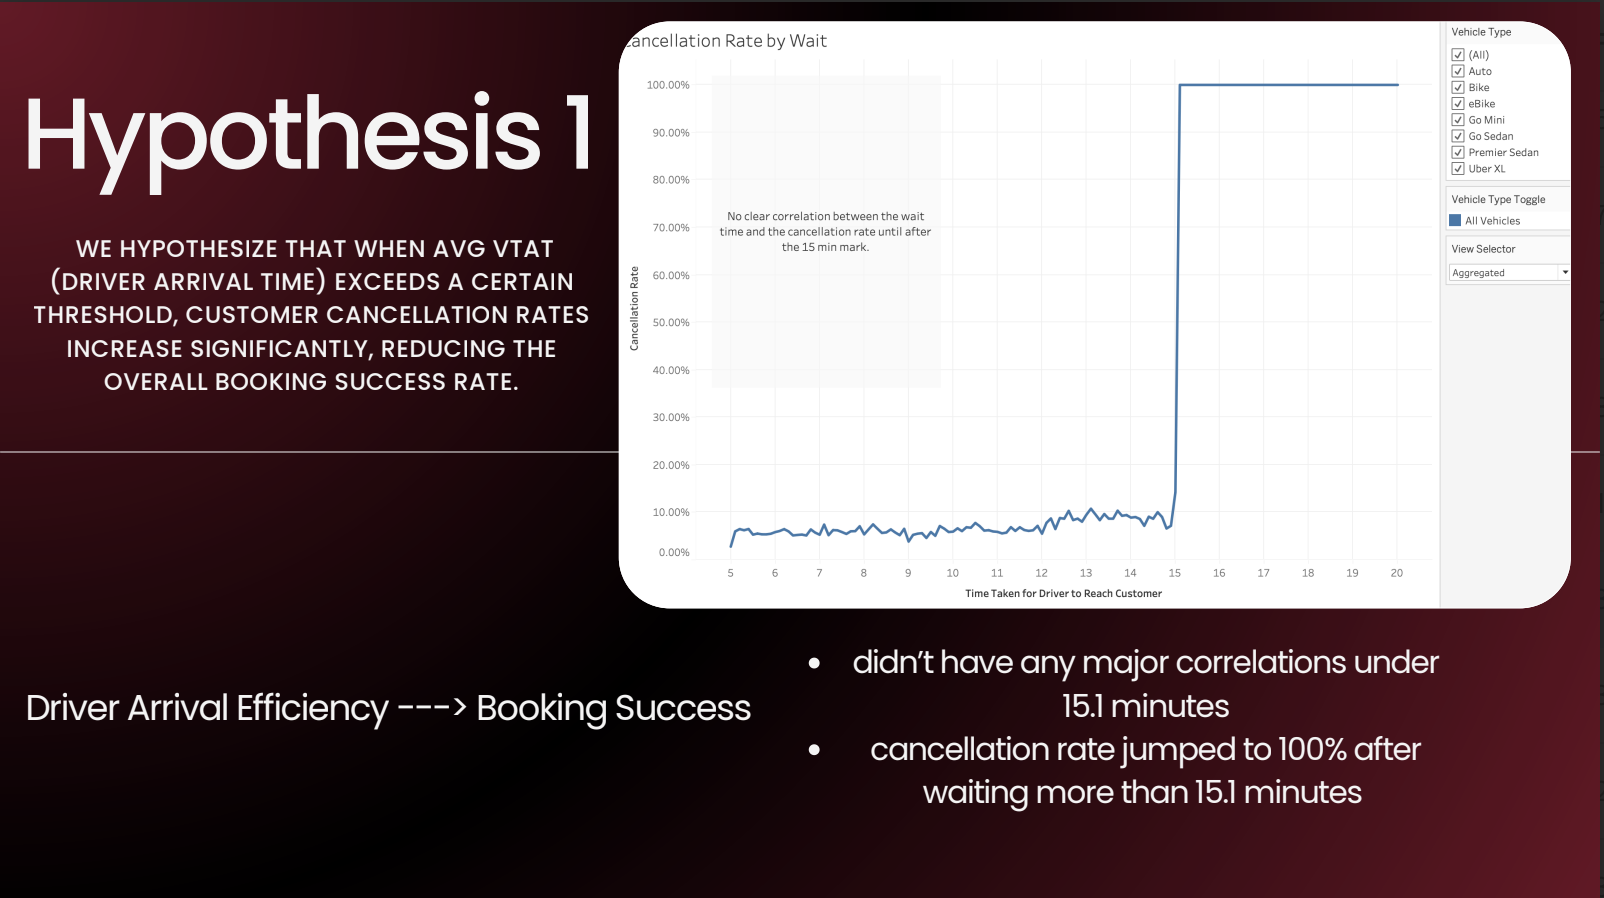
Hypothesis 1 — line chart of cancellation rate vs. driver wait time (VTAT). No meaningful correlation exists under 15.1 minutes. Past that threshold, cancellation rate spikes from ~10% to 100% across every vehicle category.
H1 design evolution. The first pass plotted all vehicle types simultaneously — too noisy to read clearly, even though the 15-minute cliff was already visible. Added a parameter toggle to collapse to an aggregate view or expand by vehicle type. The trend line was removed (R² ≈ 0.6, and the cliff speaks for itself).
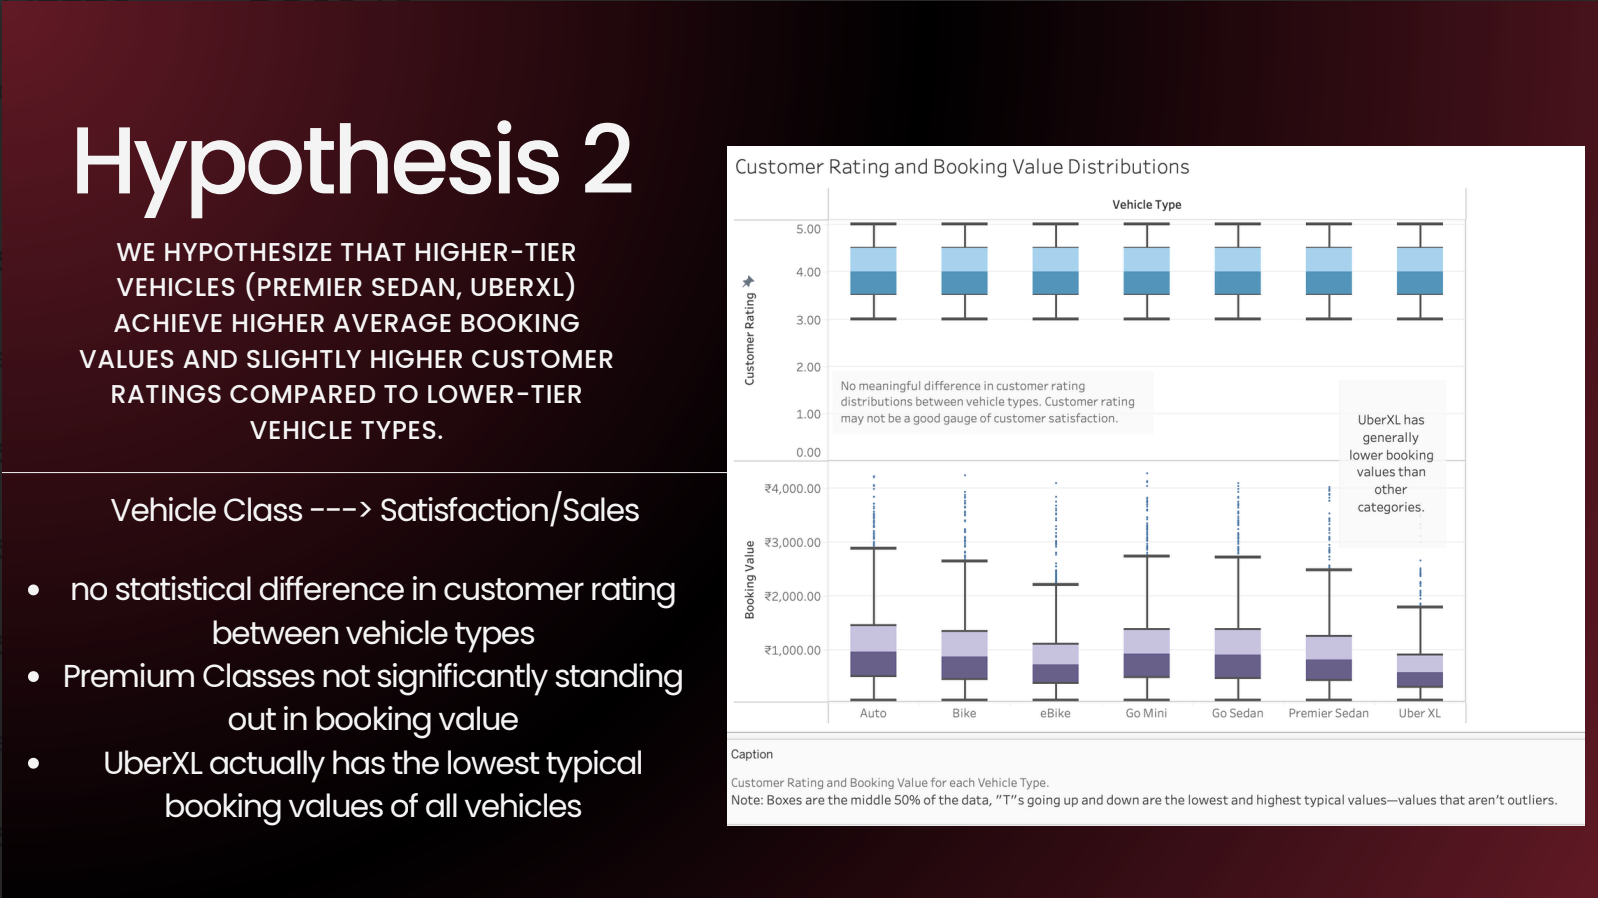
Hypothesis 2 — dual box plots of customer rating and booking value, split by vehicle class. Customer ratings are statistically flat across all vehicle types (means cluster at ~4, distributions span 3–5). Booking value tells a different story: UberXL has the lowest typical booking value of any vehicle type.
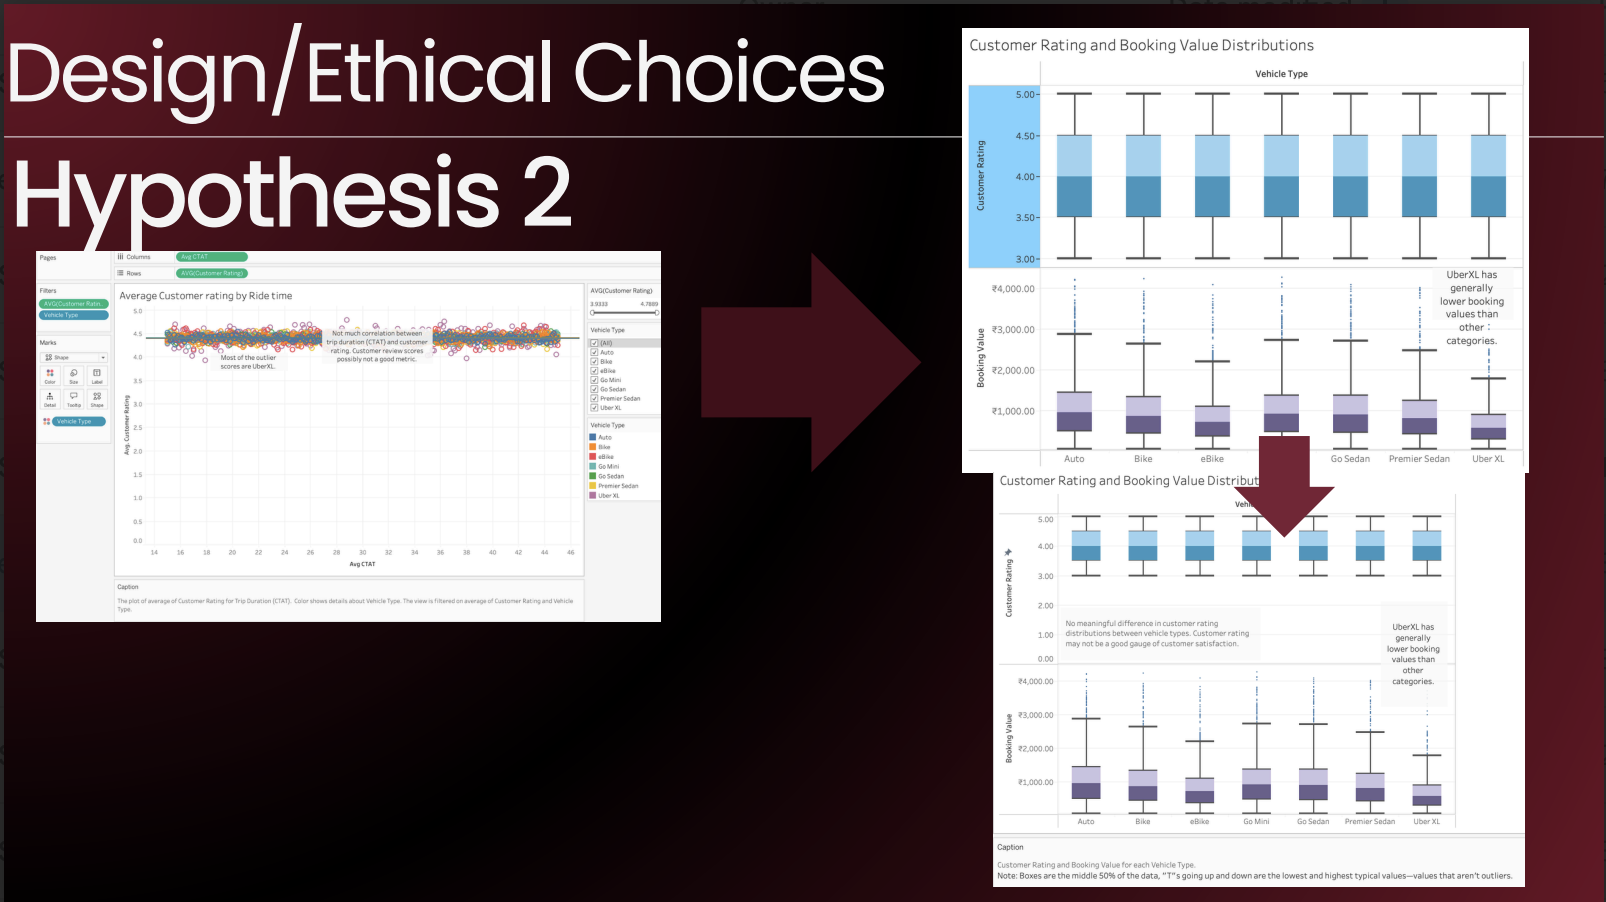
H2 design evolution. Started as a scatter plot of ride time vs. customer rating — the wrong variables entirely. Switched to dual box plots measuring booking value and customer rating by vehicle class, which directly tests the hypothesis. Also corrected the y-axis on the rating chart: Tableau defaulted it to start at 3, which would have made flat ratings look like meaningful variance.
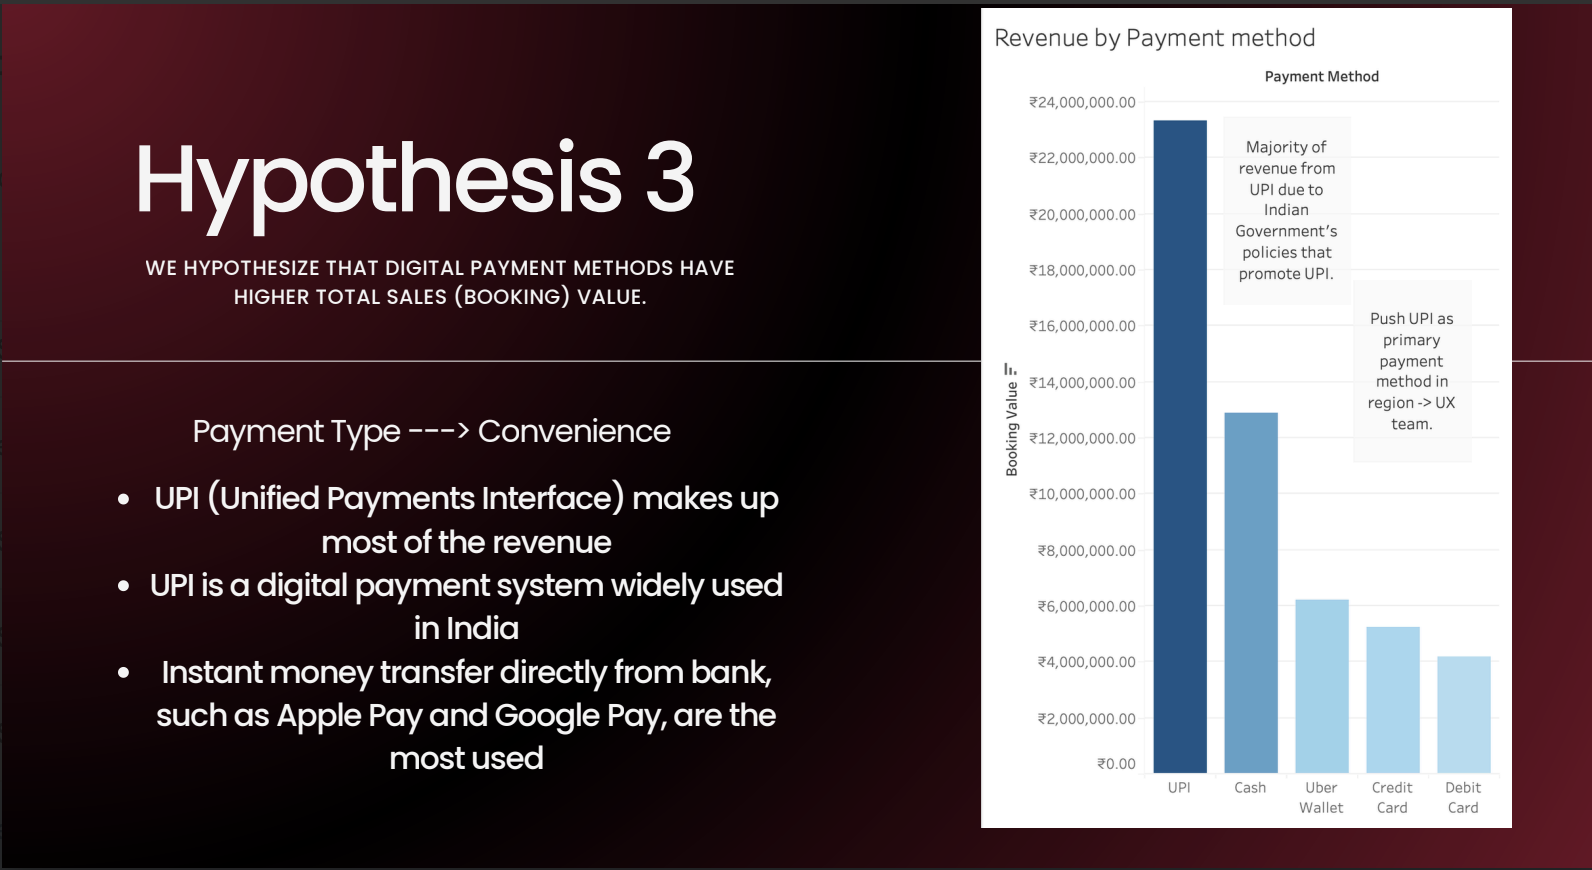
Hypothesis 3 — bar chart of total revenue by payment method. UPI (Unified Payments Interface) accounts for the majority of booking value. UPI is India's bank-to-bank digital payment system, pushed by the government as the country's primary payment rail.
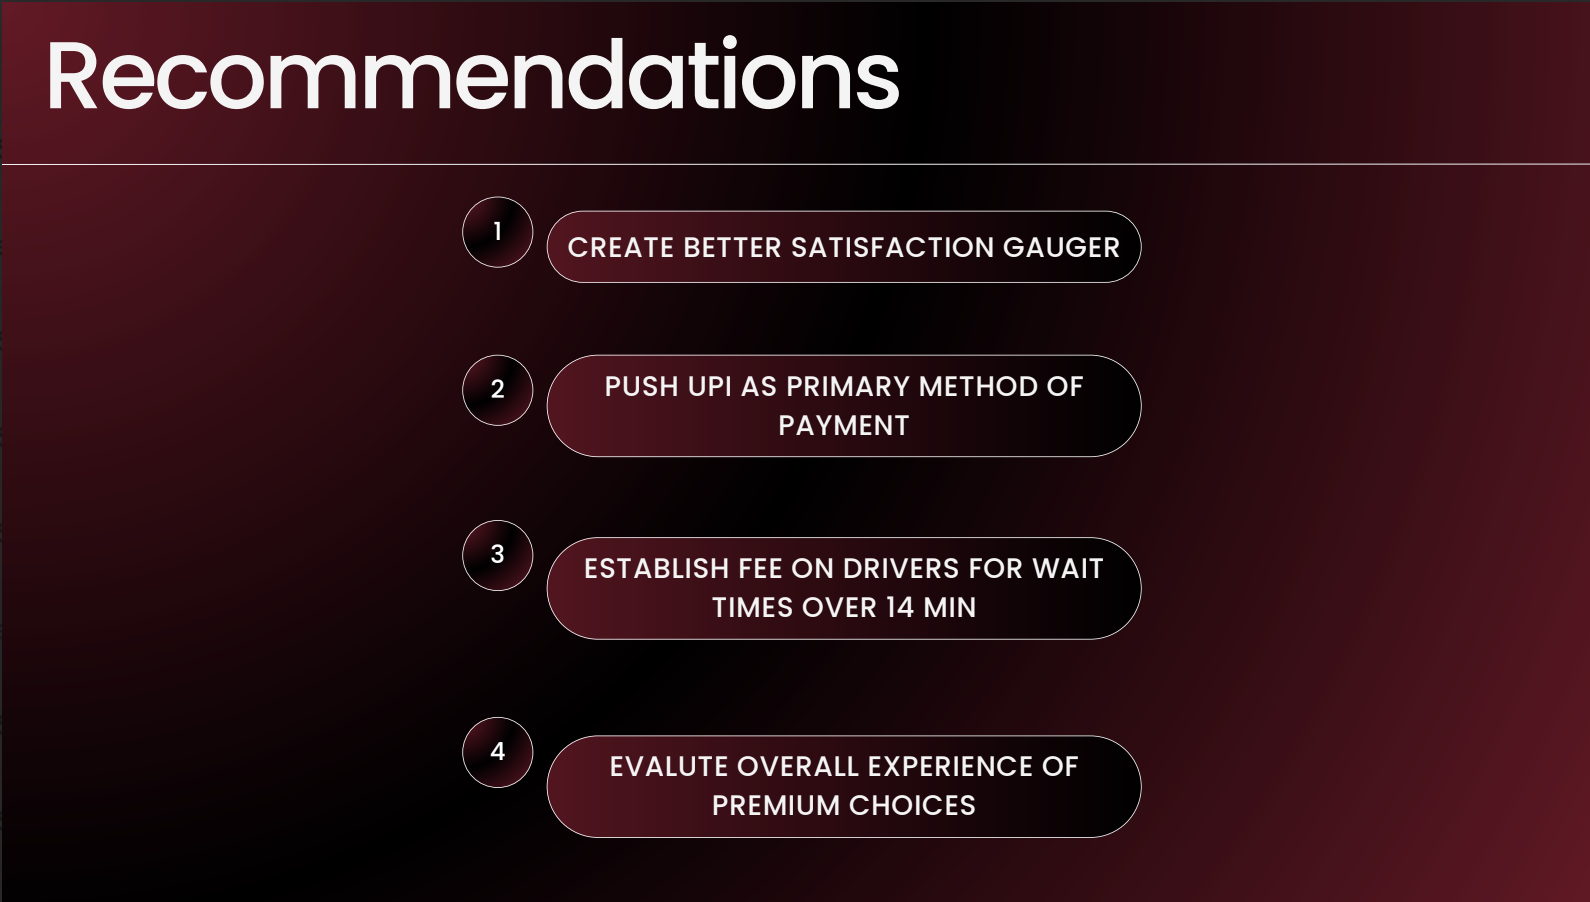
Four recommendations from the analysis: (1) build a better satisfaction signal — ratings never dropped below 3.93, so the 1–5 scale isn't surfacing real variance; (2) push UPI as the default payment method in-app; (3) introduce a driver-side fee for wait times beyond 14 minutes, since cancellations cliff at 15; (4) audit the premium vehicle experience end-to-end — underperformance at the booking-value level points to a product problem, not a pricing one.
01 / 08

Final Tableau dashboard. All three hypothesis charts consolidated under vehicle-type filters, with KPIs across the top: total booking value (revenue), average ride time, average time-to-pickup, cancellation rate, and average customer and driver ratings.

Final Tableau dashboard. All three hypothesis charts consolidated under vehicle-type filters, with KPIs across the top: total booking value (revenue), average ride time, average time-to-pickup, cancellation rate, and average customer and driver ratings.

Final Tableau dashboard. All three hypothesis charts consolidated under vehicle-type filters, with KPIs across the top: total booking value (revenue), average ride time, average time-to-pickup, cancellation rate, and average customer and driver ratings.

Final Tableau dashboard. All three hypothesis charts consolidated under vehicle-type filters, with KPIs across the top: total booking value (revenue), average ride time, average time-to-pickup, cancellation rate, and average customer and driver ratings.

01 / 08

Ride Value Visualized

Rs51.8M in bookings across the analyzed rides

Business Questions Framed

3 decision-oriented views built from one ride dataset

Operational Risk Isolated

Cancellation threshold identified at the trip level (15.1 min)

POST-PROJECT REFLECTION

What I Took Away

What I learned. Ranges anywhere from technical skills, to general lessons.

My goal is to always learn from an experience, no matter how big or small.

My first draft for H2 was a scatter plot of ride time vs. customer rating. That chart has nothing to do with whether premium vehicles generate higher booking values or ratings — it doesn't even use those variables. Catching that and switching to dual box plots (booking value distribution and customer rating distribution, both split by vehicle type) was where the real analytical work happened. The wrong chart looked analytical. The right chart actually tested the claim. That distinction — does this visualization answer the hypothesis or does it just look like it does — is the main thing this project sharpened.
The minimum observed rating was 3.93 across every vehicle type and category, so starting the axis at 3 was technically accurate and made differences more visible. I corrected it to start at 0 anyway. A reader who doesn't notice the axis origin will read the chart as showing dramatic rating differences across vehicle types. It doesn't. Deliberately or not, that kind of scaling misleads — and I'd rather lose a visual effect than imply a finding that isn't there.