Project / Spring 2026

Small-Business Credit Desert Early Warning System

Year

Spring 2026

Type

Data Engineering · ML Forecasting · Public-Interest Analytics

Skills

XGBoost

Geospatial Feature Engineering

Walk-Forward Validation

Rare-Event Modeling

Pipeline Design

MapLibre / Dashboard Product

What I Built

A two-layer XGBoost forecast and interactive dashboard predicting small-business credit deserts at 3- and 6-year horizons across 77K U.S. census tracts.

Built an end-to-end forecasting system that predicts which U.S. tracts and counties will become small-business credit deserts in 2027 and 2030. Trained on a 2.97M-row tract-year panel stitched from CRA, HMDA, ACS, FDIC, and SSBCI sources. Shipped as an interactive MapLibre dashboard covering 77K tracts and 3,142 counties.

The system splits prediction into two lenses: a Diagnostic model that shows whether demographic and environmental conditions are driving local credit risk, and an Influenceable model that isolates lending-environment variables — branches, mission lenders, lender concentration, state programs — that policy could actually move. Both models are XGBoost classifiers evaluated walk-forward across 8 time-split folds with per-fold isotonic calibration, and the dashboard pairs them with scenario sliders that let users move a lever and watch the national risk map recolor live.

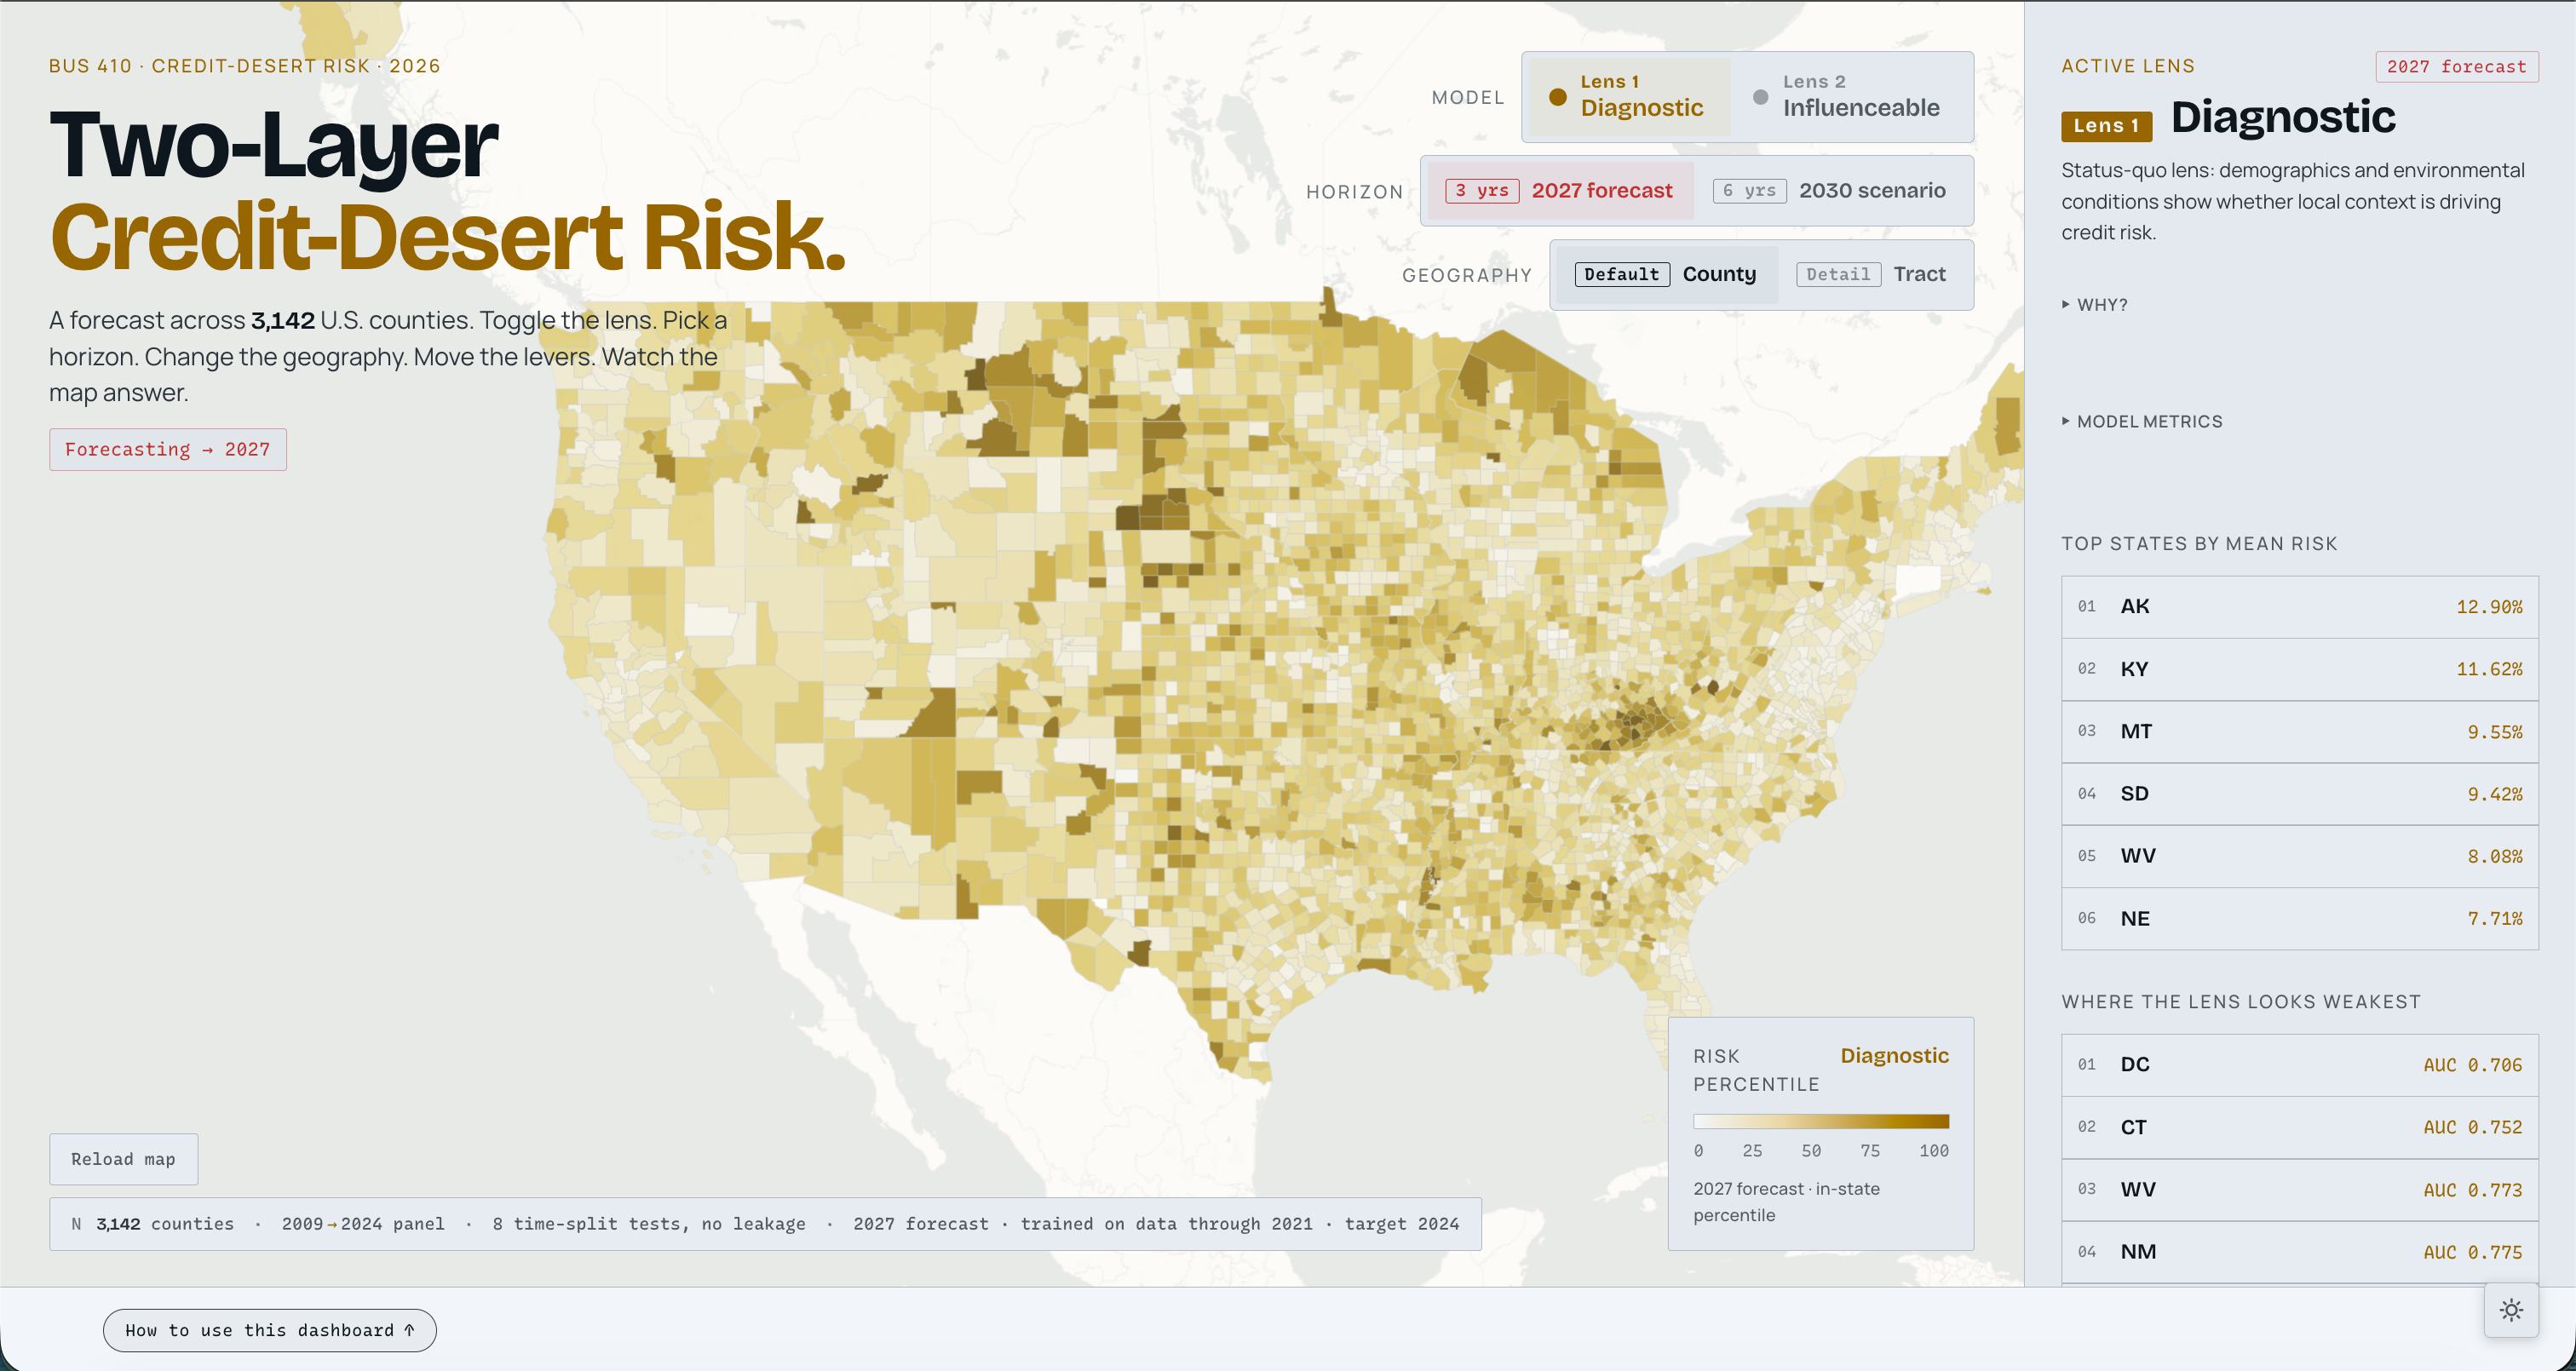
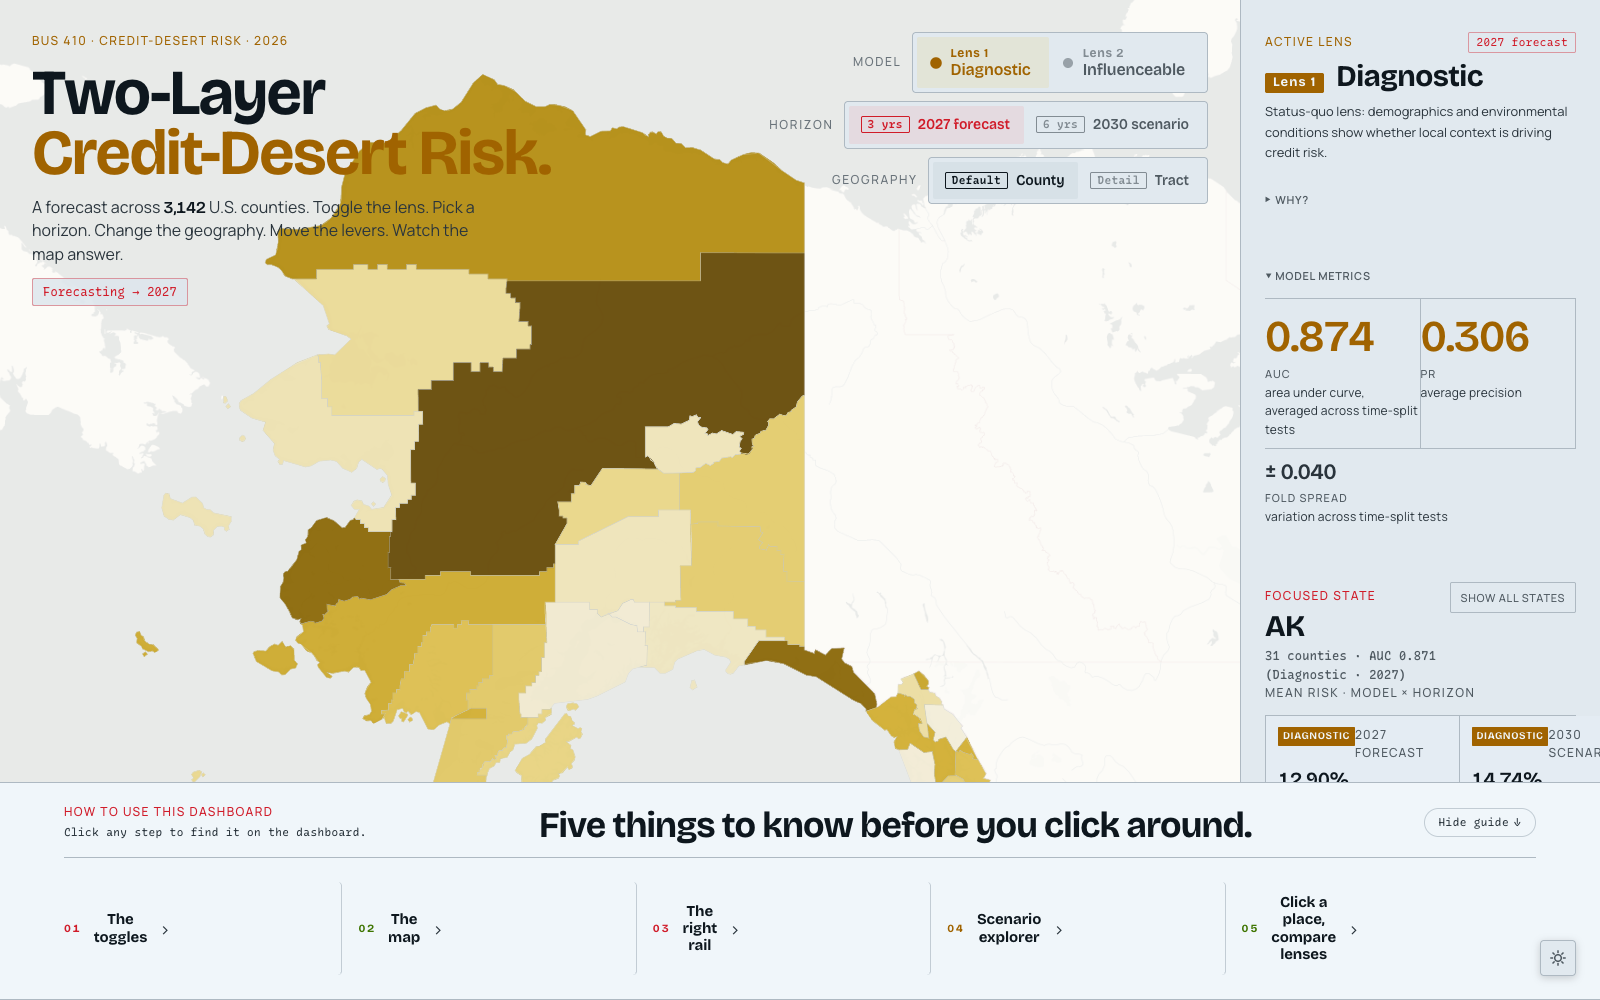
National county view, Diagnostic lens at the 2027 horizon.
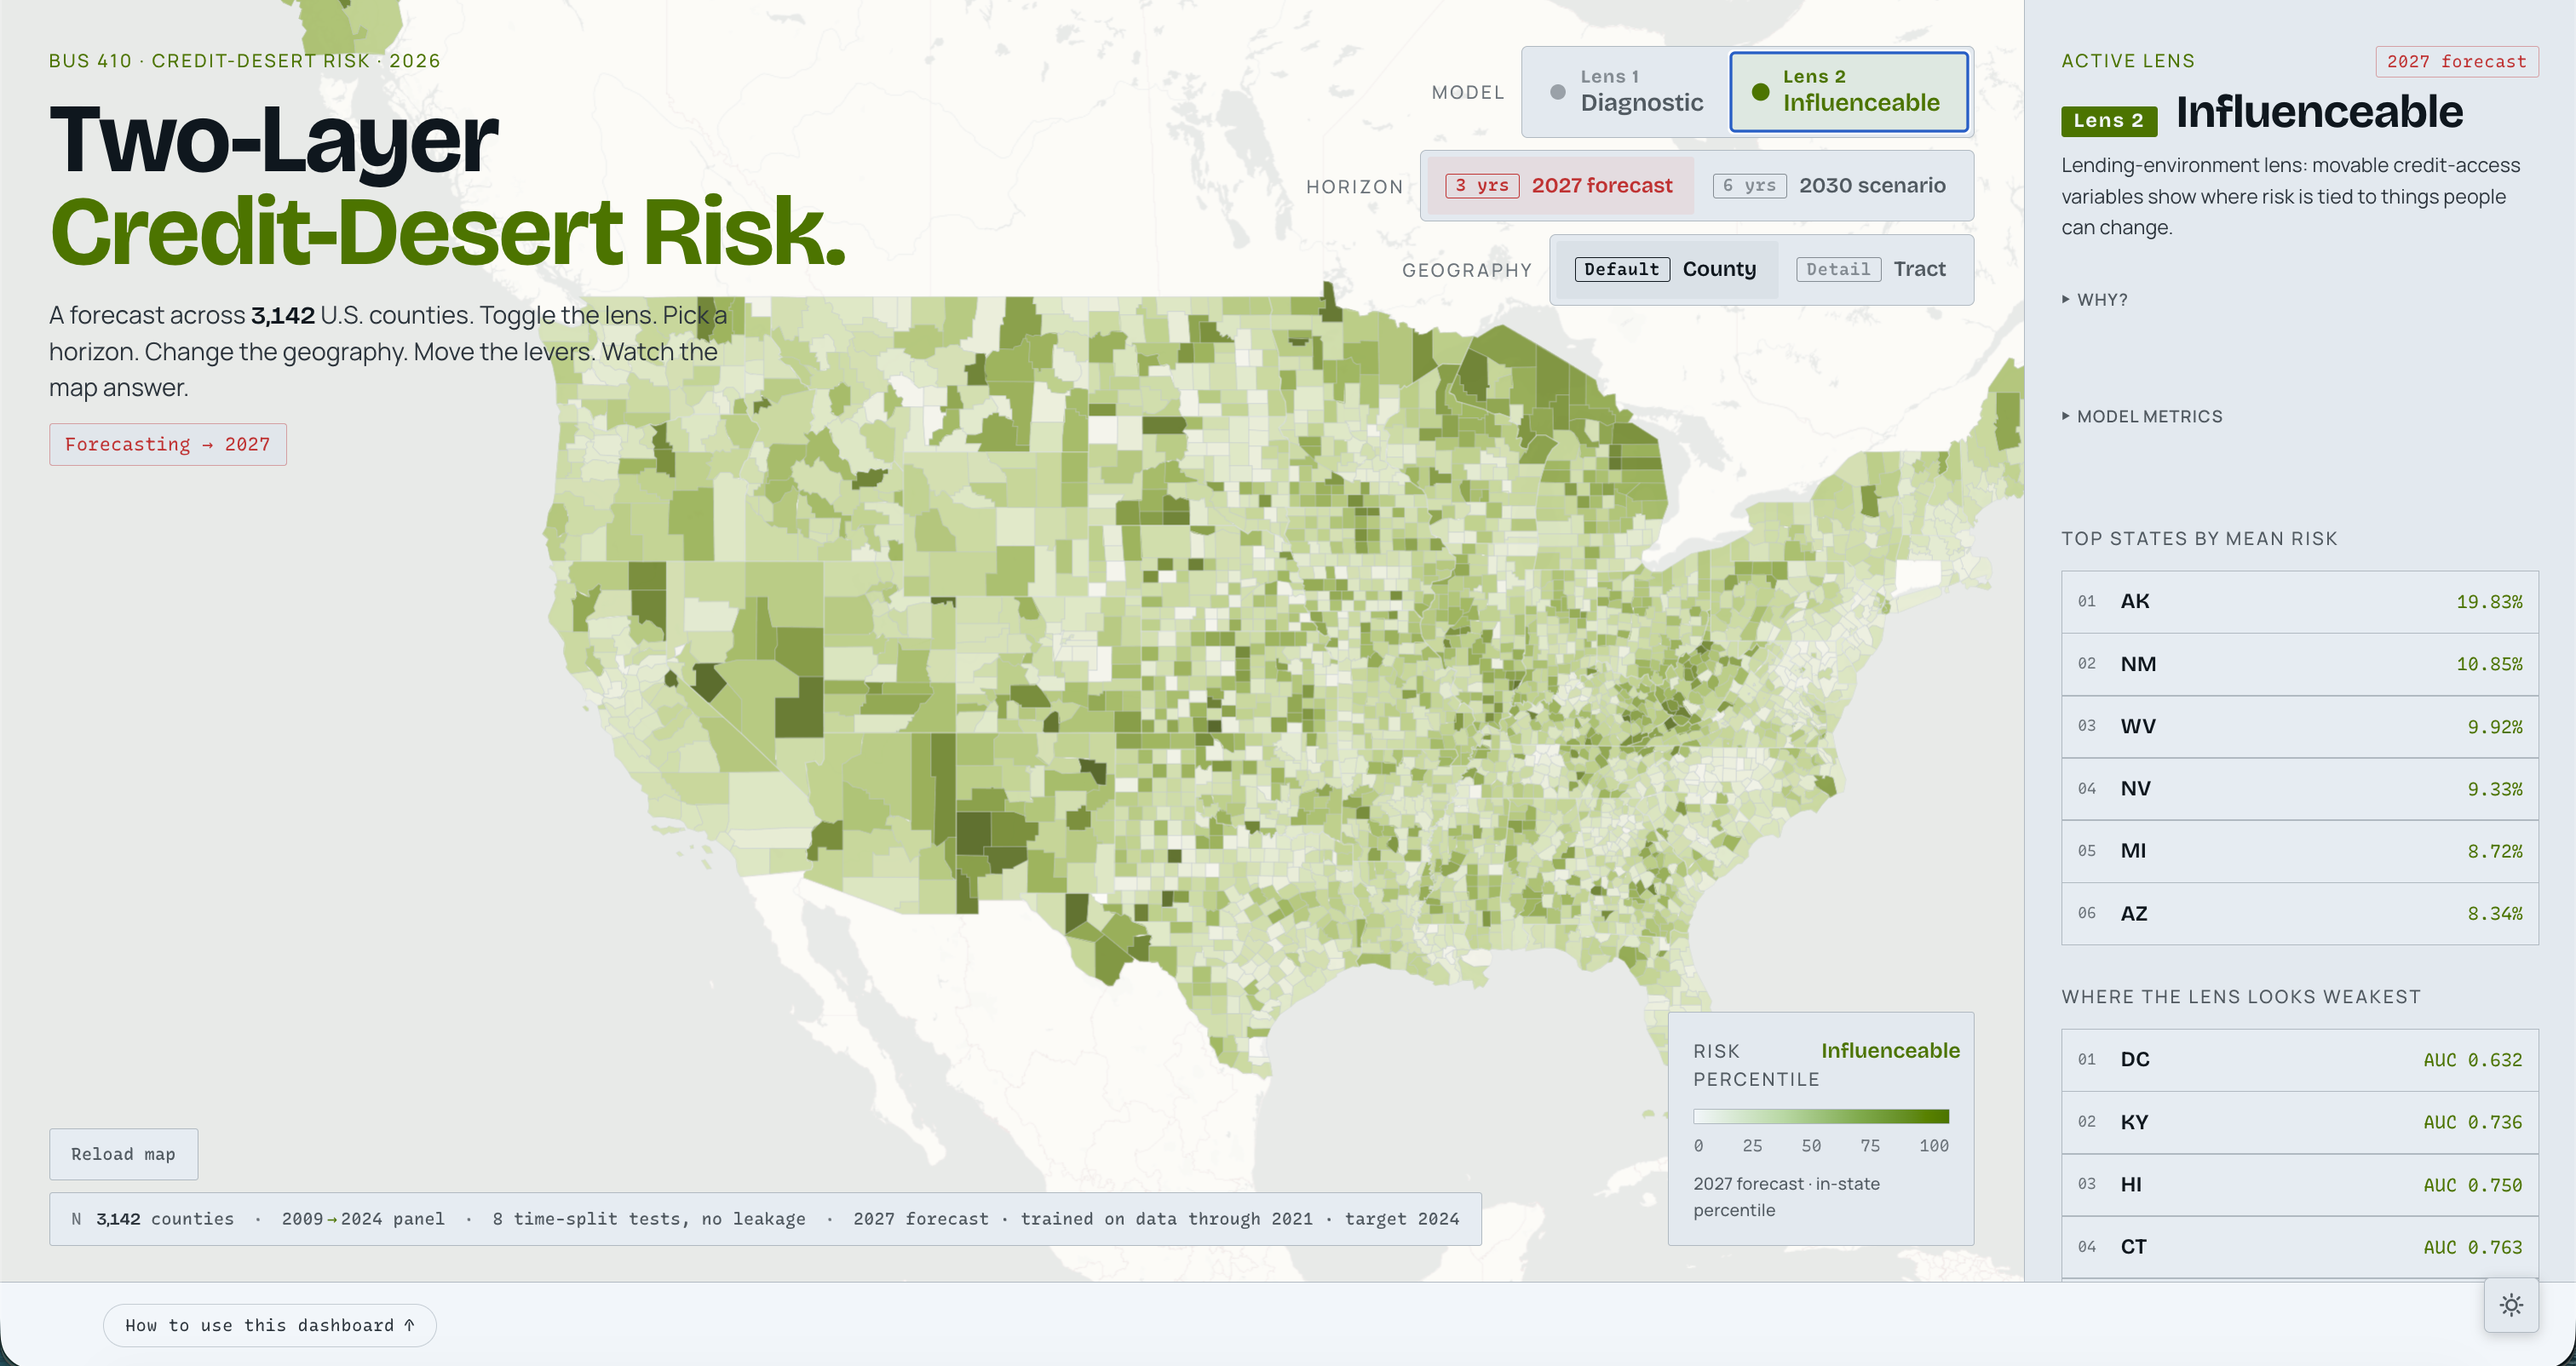
Influenceable lens: same map, recolored to highlight lending-environment risk only.
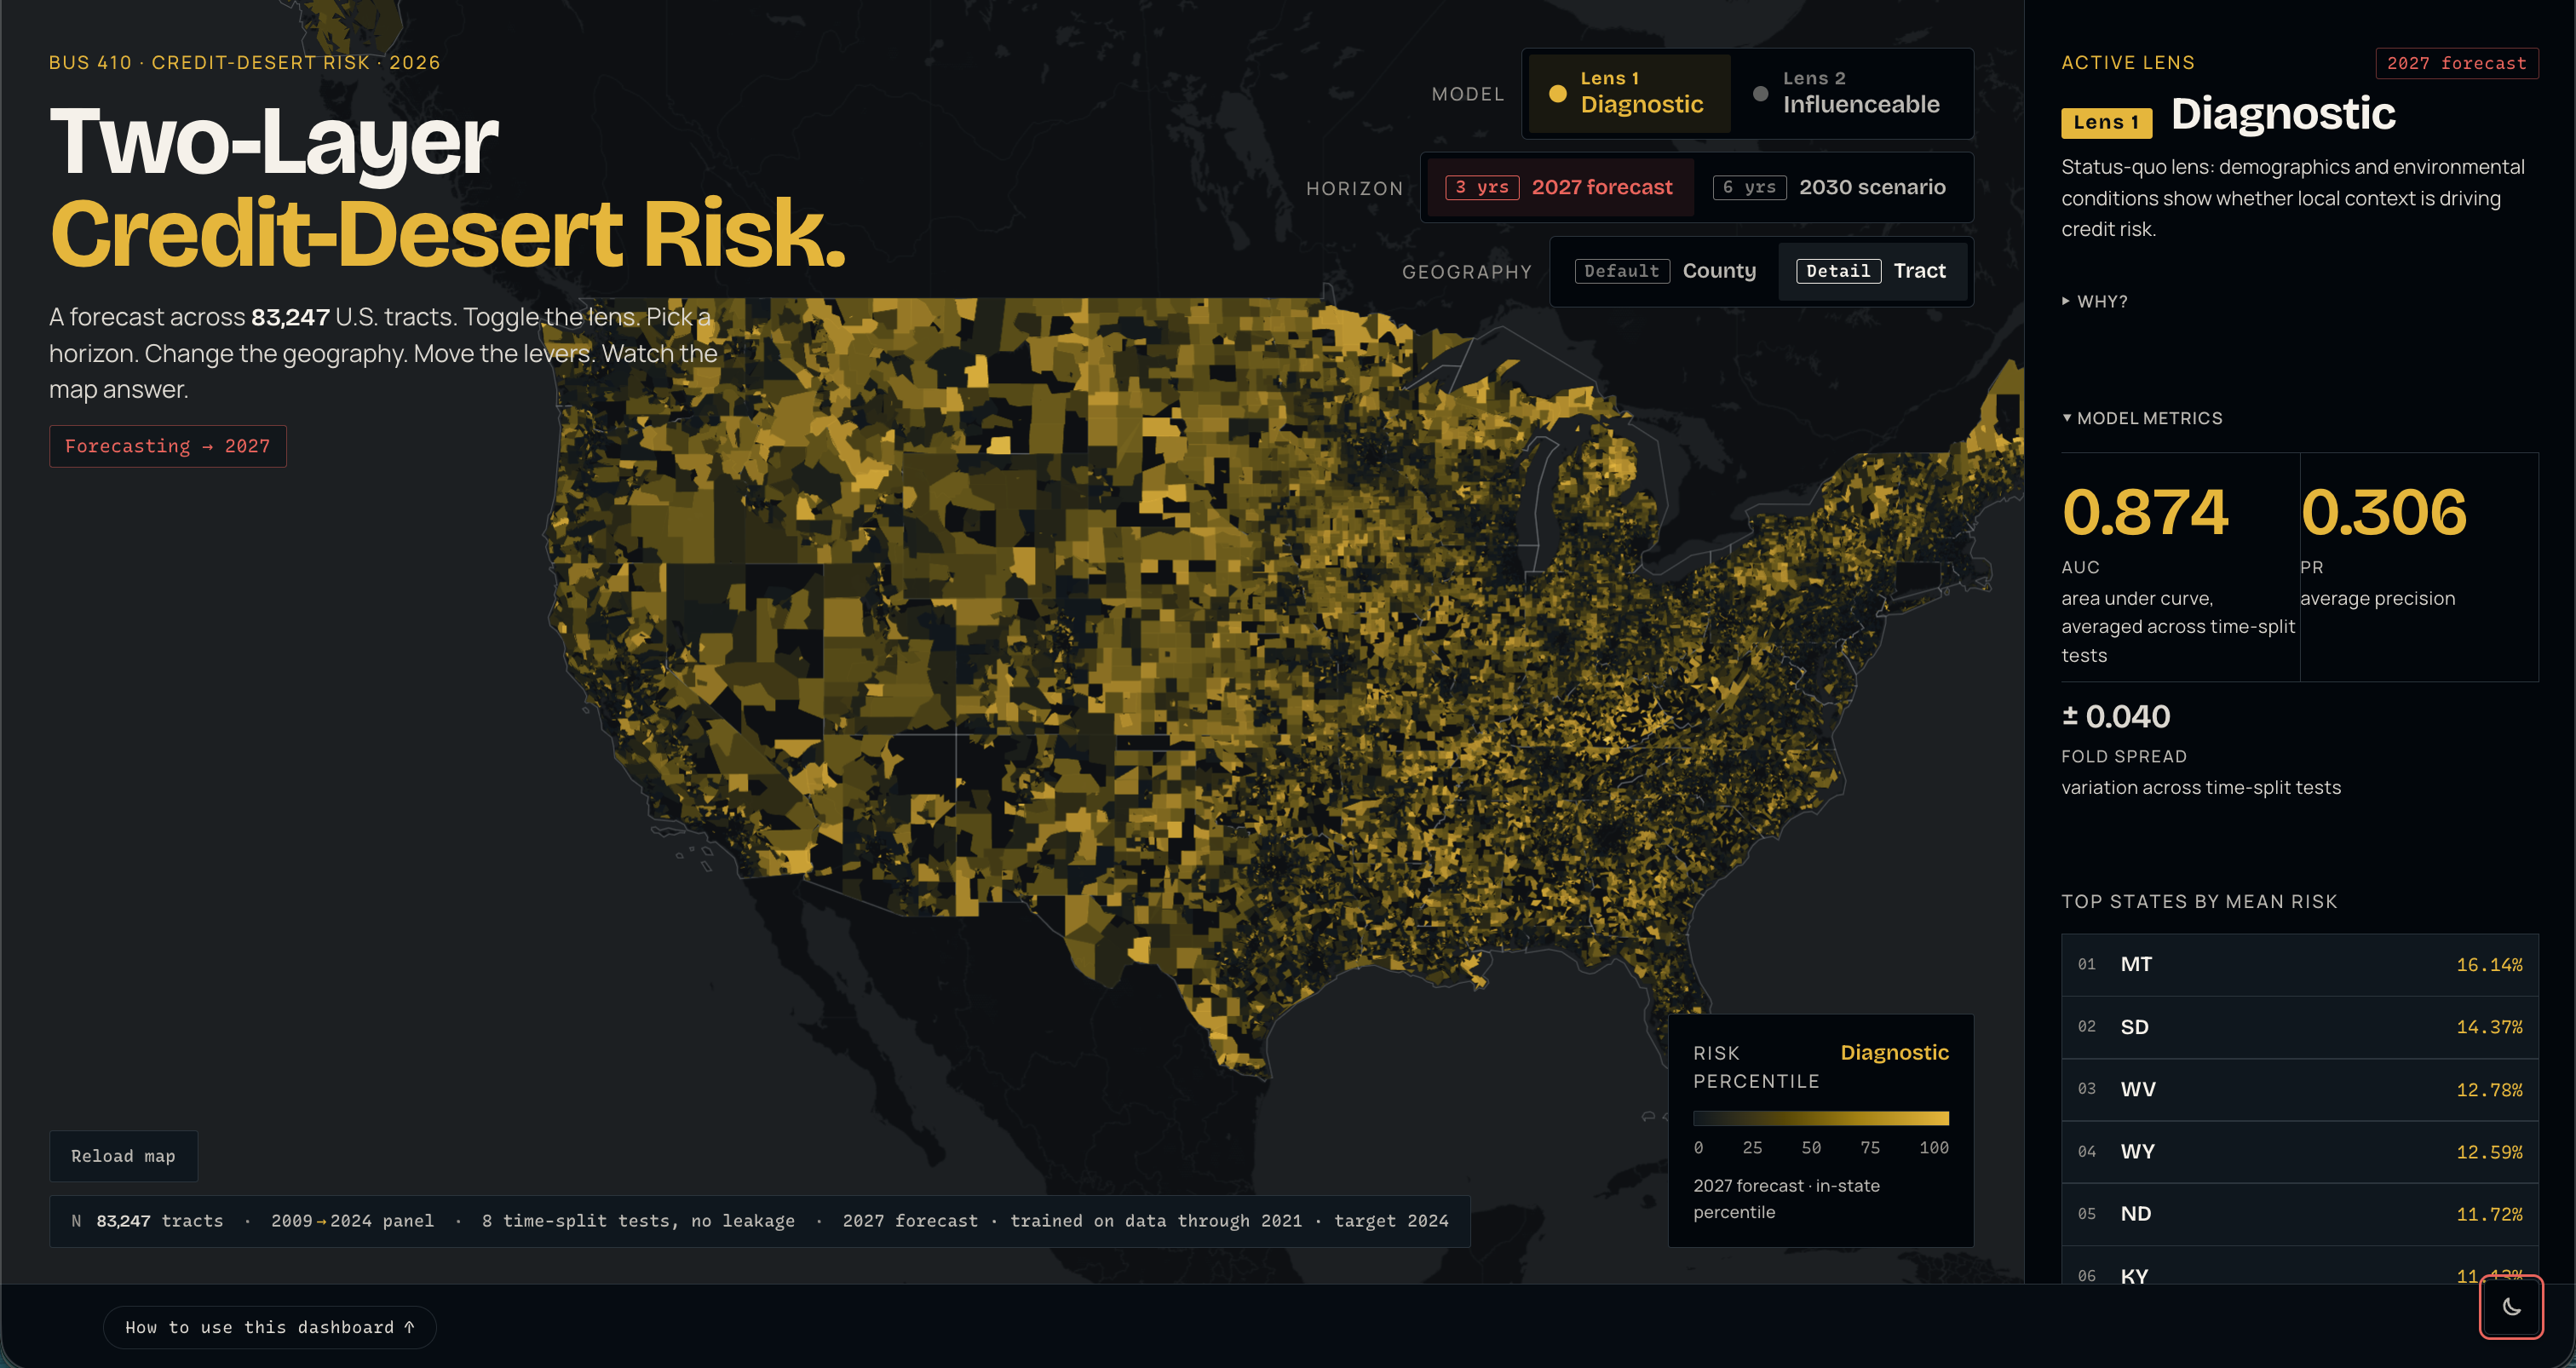
Dark mode at tract resolution — 83,247 tracts colored by Diagnostic risk, with model metrics in the right rail.
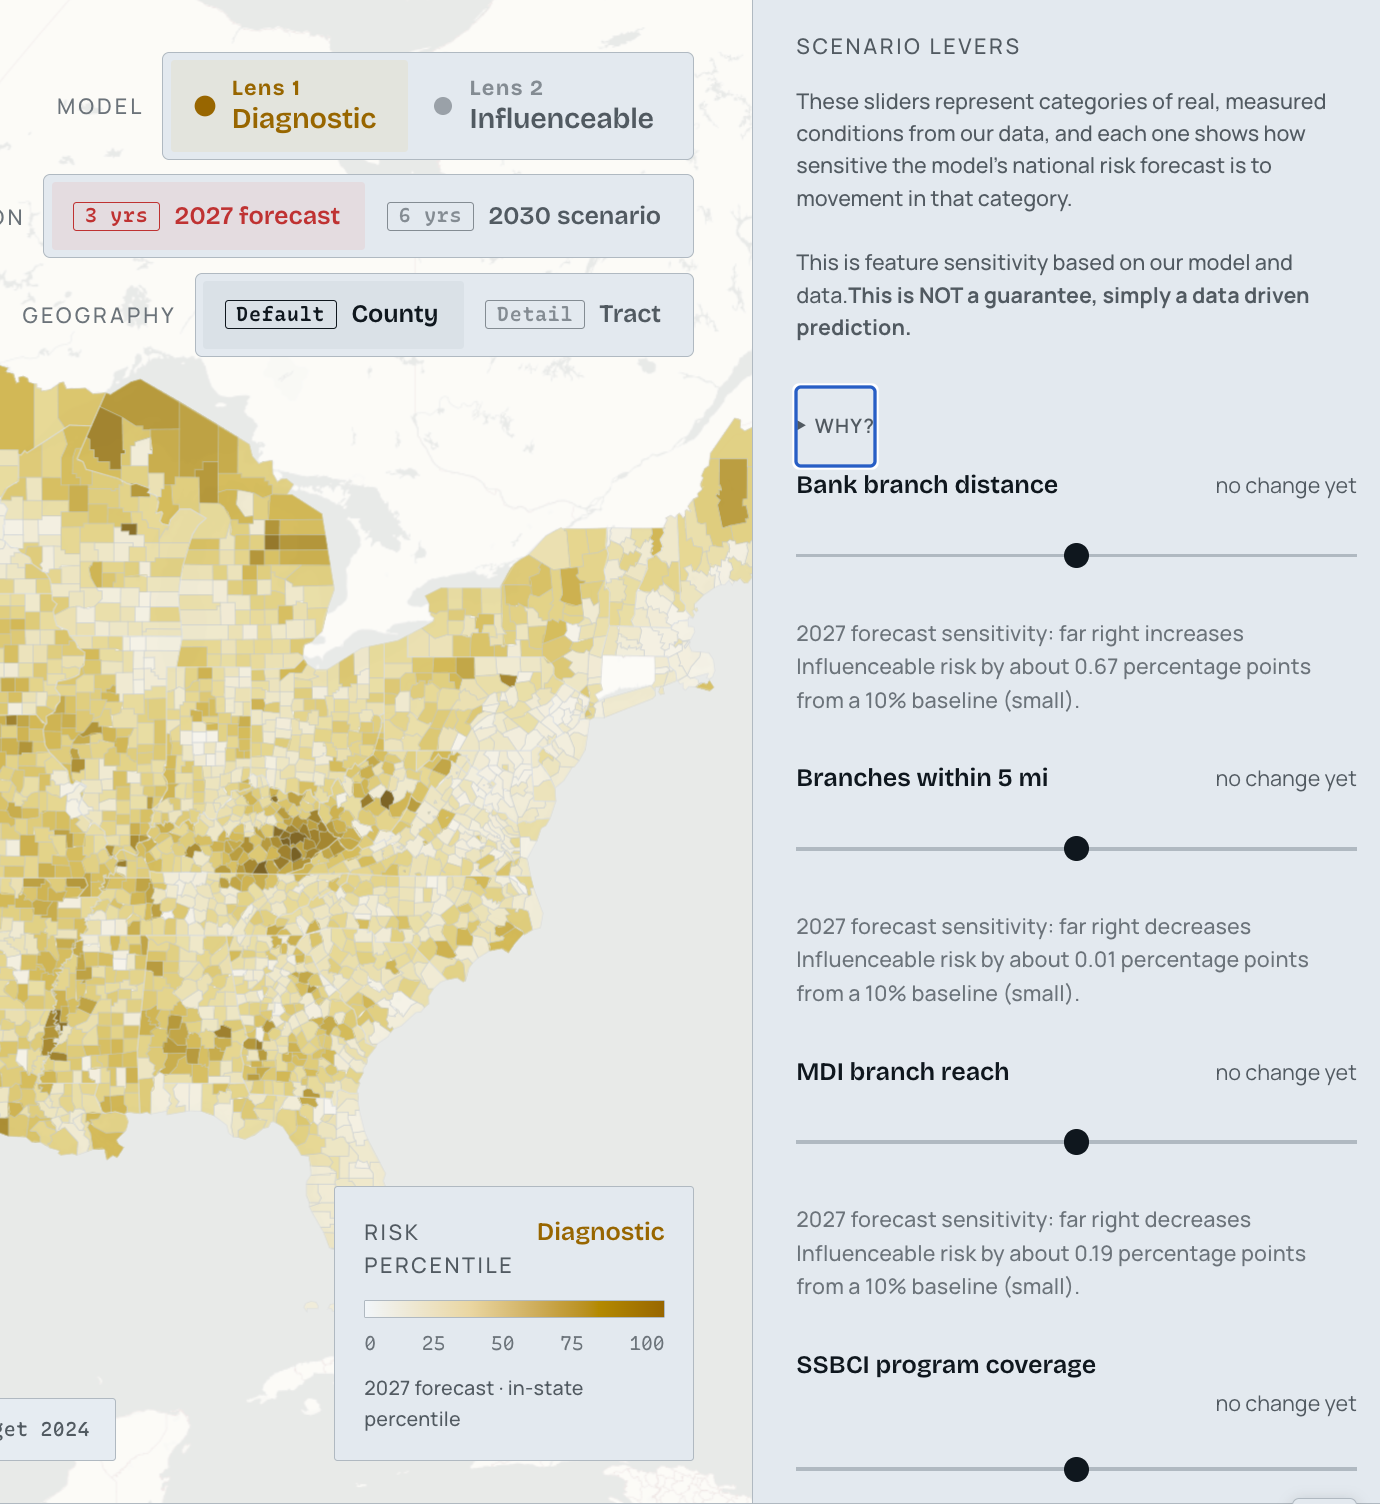
Scenario sliders — bank branch distance, branches within 5 mi, MDI branch reach, SSBCI program coverage — recolor the map live.
State drill-down: clicking AK swaps the right rail for an in-state percentile view.
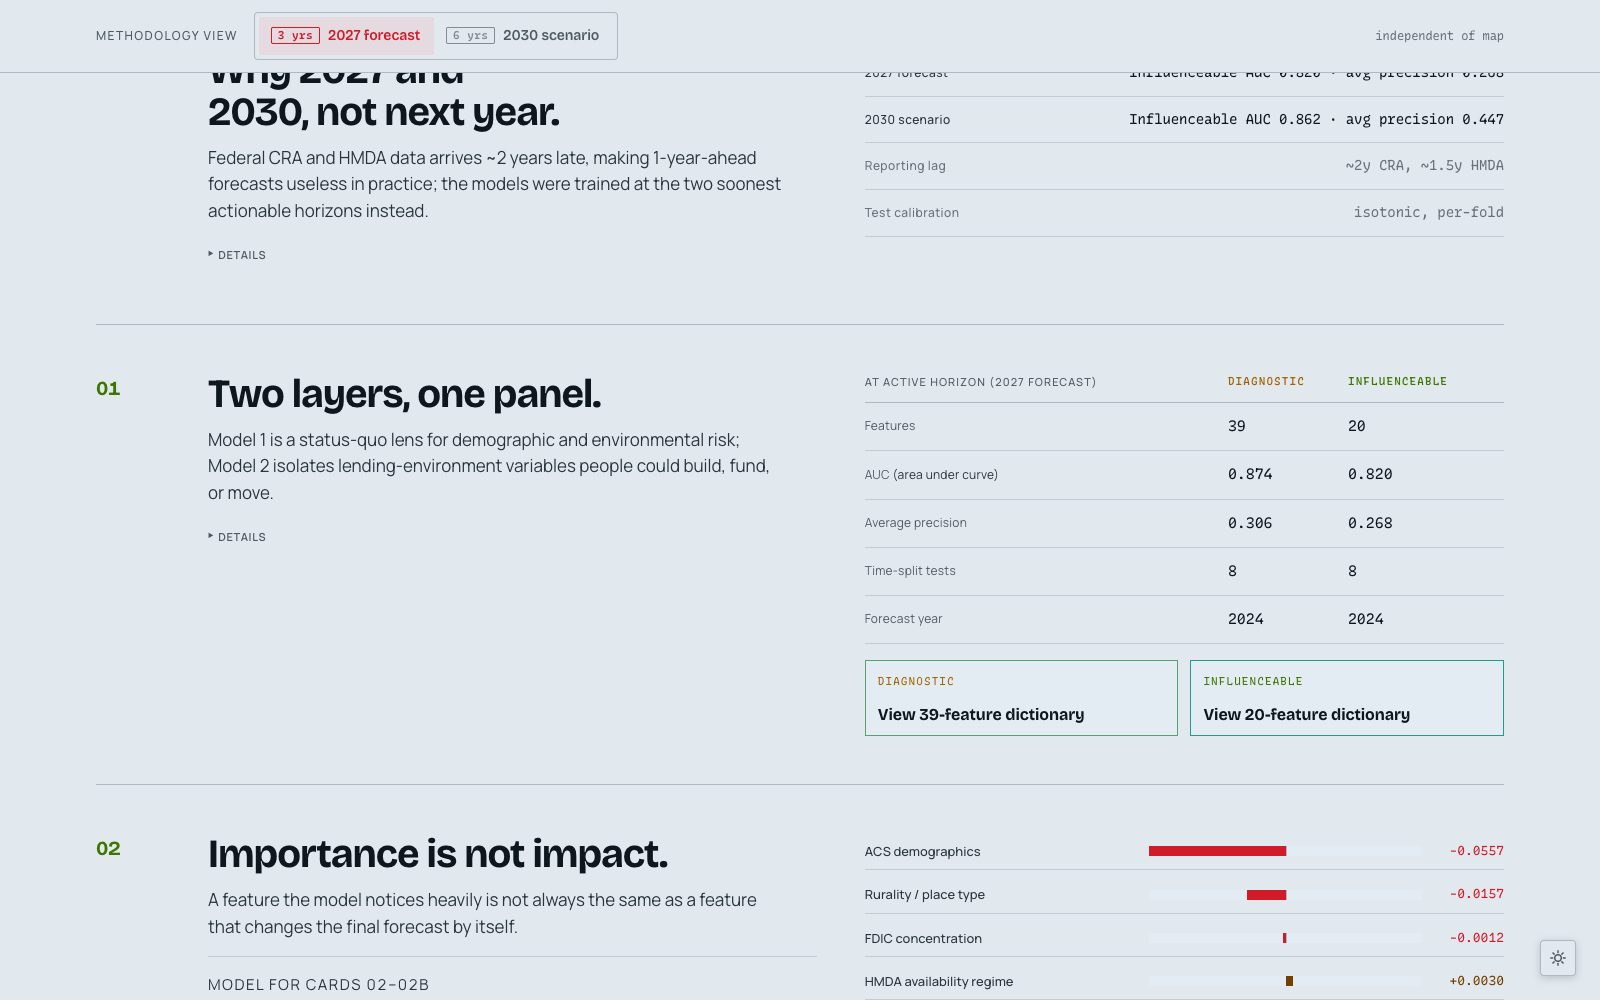
Methodology: federal CRA/HMDA data lags ~2 years, so 1-year-ahead forecasts are useless — 2027 and 2030 are the soonest actionable horizons.
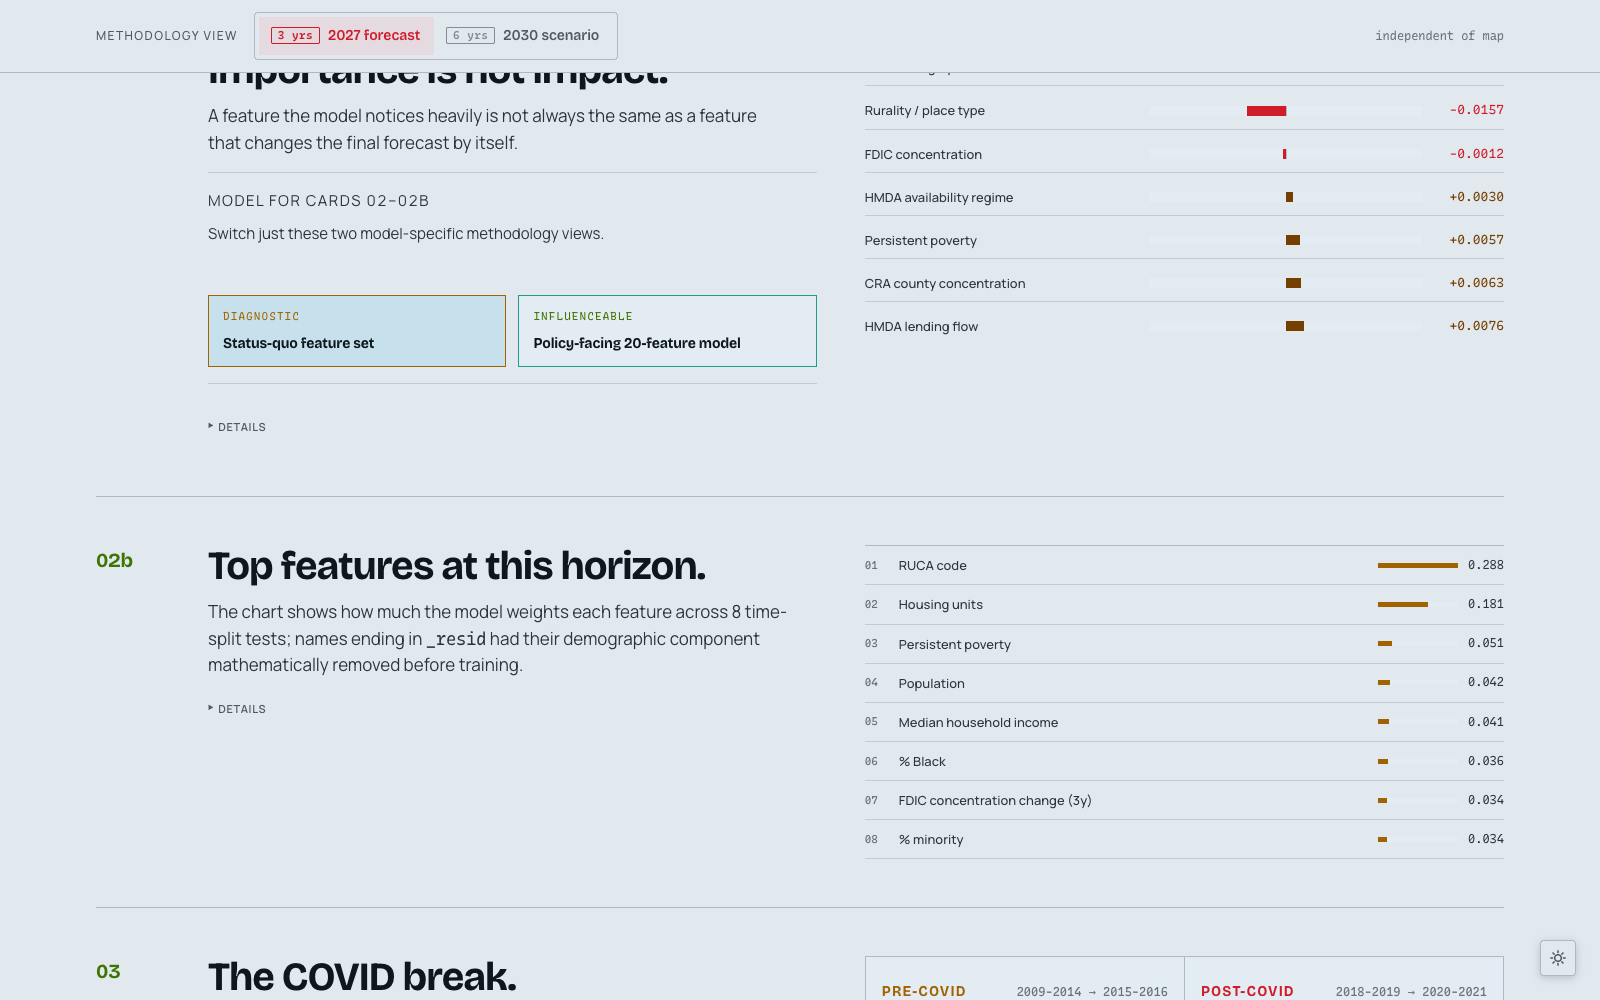
Feature-group sensitivity: how each category of input pulls the forecast.
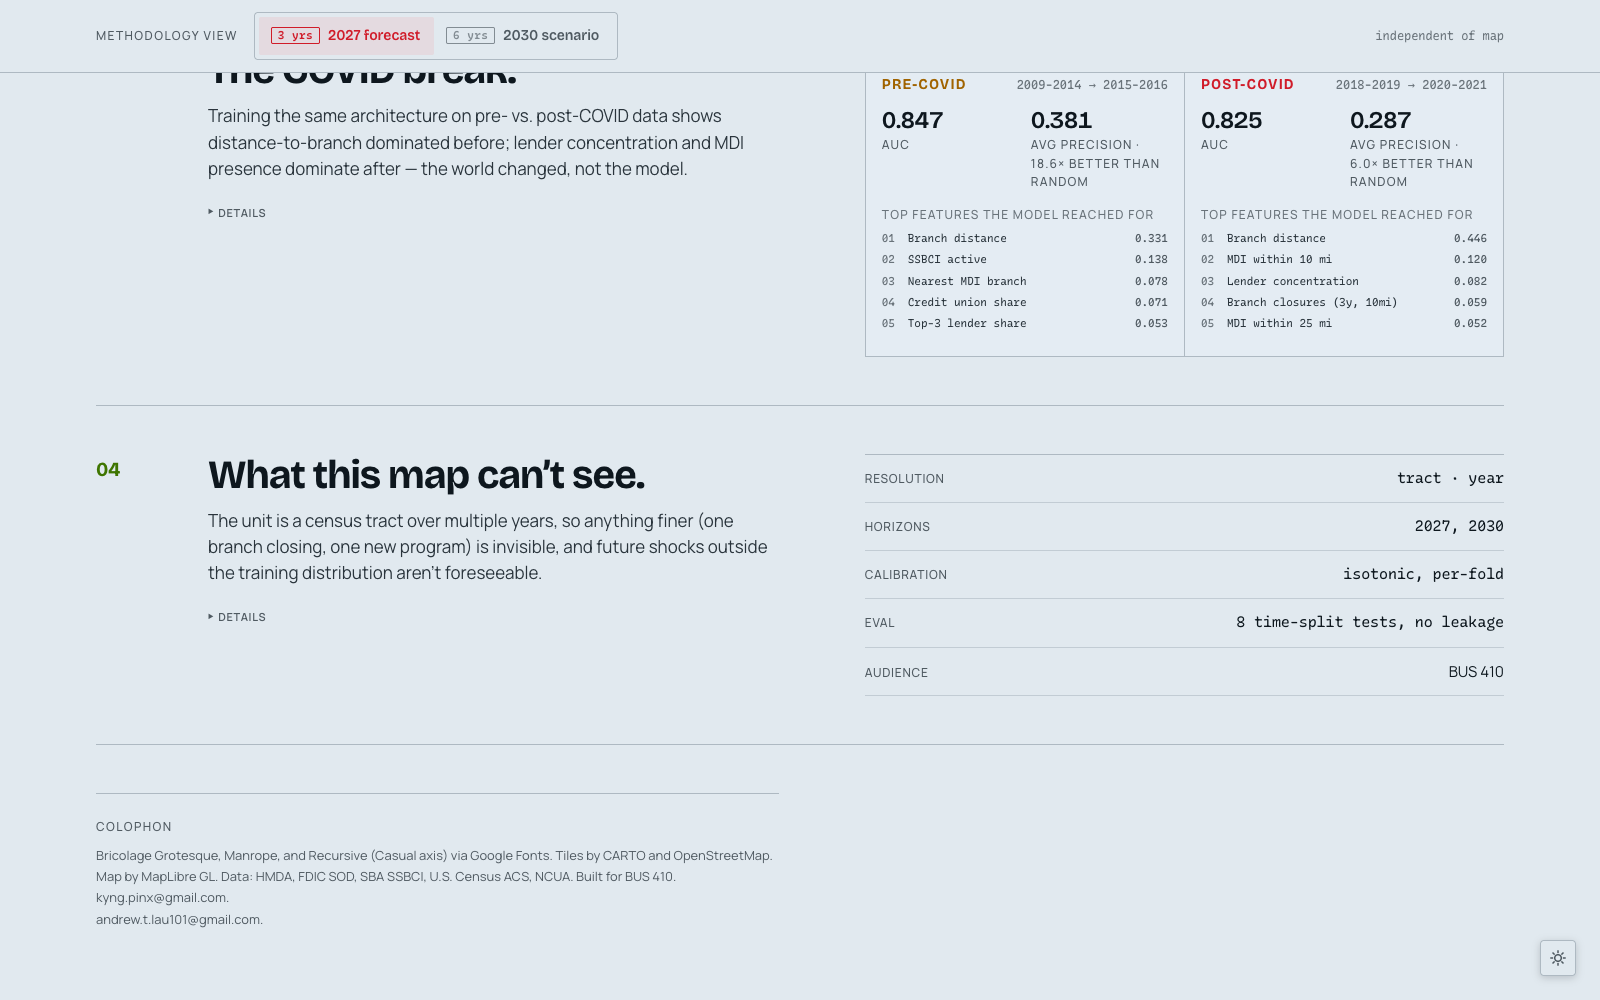
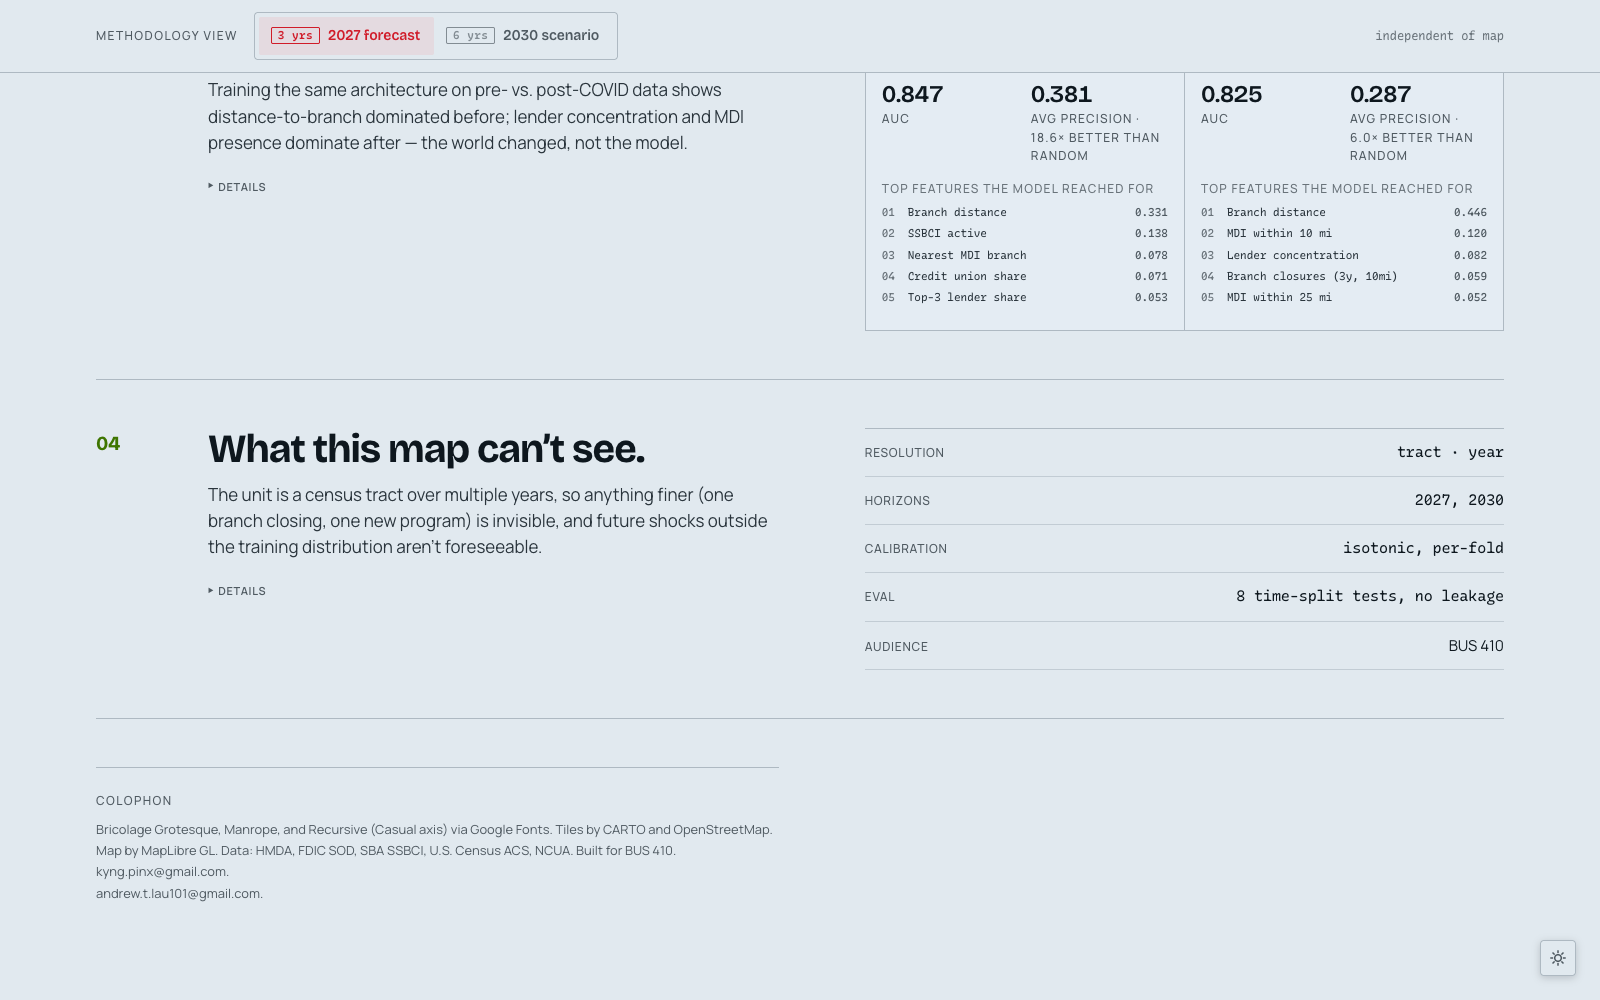
Pre/post-COVID regime split — short-horizon AUC fell from 0.817 to 0.734 after 2020.
What we still can't see: CDFI geocoding gaps, intra-county lender shifts, and the limits of administrative data.
01 / 10

Full dashboard walkthrough: lens swaps, horizon toggle, tract zoom, state drill-down, and scenario sliders.

Full dashboard walkthrough: lens swaps, horizon toggle, tract zoom, state drill-down, and scenario sliders.

Full dashboard walkthrough: lens swaps, horizon toggle, tract zoom, state drill-down, and scenario sliders.

01 / 10

Panel Scale

77,036 tracts · 3,142 counties · 2009–2024

CRA Records Ingested

20.1M rows across federal lending data

Best Model Fit (h+3)

Diagnostic AUC 0.875 · AP 0.322

POST-PROJECT REFLECTION

What I Took Away

What I learned. Ranges anywhere from technical skills, to general lessons.

My goal is to always learn from an experience, no matter how big or small.

Halfway through the project we realized our cleanest model wasn't the most useful one. Our original approach was a single tract-level XGBoost trained on every feature we could pull together — demographics, environment, branch geography, lender concentration, state programs — that ranked tracts by predicted credit-desert risk. The headline metrics were strong and the map looked sharp.

The issue: our model was trained well, but it doesn't tell anyone what to do — and a lot of the strongest features (median income, racial composition, prior loan volume) describe conditions nobody can directly change.

So we split the architecture into two lenses. Diagnostic uses 39 features — demographics, environment, status-quo signals — to show *where* small-business credit risk is concentrated. Influenceable uses 20 features drawn only from the more short-term lending environment — bank branches, CDFI/mission lenders, lender concentration, SSBCI state programs — variables policymakers, lenders, and community lenders can actually move.

We could've been content with just the diagnostic model, but we built the additional lens, because a policy lens—something you can act on—beats one that tells you nothing of how to fix the problem.

Credit deserts are by definition rare events. The base rate of a tract becoming a "service desert" at a given horizon hovers around 1–2%, which means a model can hit 98% accuracy by predicting "not a desert" for every tract on the map. AUC has the same problem in milder form — it stays high even when the model is useless at the top of the ranking.

We evaluated everything against average precision (AP) and AP-lift over the random baseline, walk-forward across 8 time-split folds, with per-fold isotonic calibration so the probabilities meant something. The final h+3 Diagnostic fit was AUC 0.875 / AP 0.322 — about 19× lift over a 1.7% baseline. We reported fold spread on every metric so the headline number couldn't hide variance.

Going into the presentation, we built six scenario sliders into the Influenceable lens — SSBCI coverage, bank branch density, microlender reach, lender concentration — originally designed as a what-if engine. The idea: move the SSBCI slider up, watch tracts cross the high-risk line, hand a policymaker a number. Intuitive, satisfying, and ultimately not grounded in anything real.

Each slider represents a category of real, measured conditions from the data, and shows how sensitive the model's national risk forecast is to movement in that category. We computed those sensitivities through ablation: train the model, remove a feature category, and measure how predictions shift without it. What we found was uncomfortable. Moving any single lever, or multiple levers simultaneously, barely changed the risk percentages for most tracts and counties; the needle almost doesn't move across a lot of them.

That felt like a failure until we thought through the alternative. We could have tuned the sliders to produce bigger swings — more dramatic recoloring, a more satisfying simulation. But that would have been made-up numbers wearing the clothes of analysis. The model doesn't behave that way, and dressing it up to look like it did would have misled anyone who trusted the output.

The sensitivities also aren't uniform across the map. A slider that barely moves the national aggregate might shift a specific at-risk county by a full percentage point. The story is in the *where*, not the average.

So we kept the sliders honest. The in-product copy says explicitly: this is sensitivity, not a causal guarantee. The real value of the dashboard was never "move lever → fix problem." It's identifying *where* risk is concentrated and *why* — and making that legible to the people who can actually act on it.